
 +86-0755-86131192
 2025-05-19
Do your feet ache after running on the treadmill? Feel like one foot gets more tired after standing for a long time? Your plantar pressure distribution might be the issue.
Today, more and more rehabilitation centers and sports medicine institutions are introducing a cutting-edge tool — the plantar pressure plate analysis system. It reveals the “invisible secrets” under your feet when walking or standing. But here comes the question: can you actually understand the data in the test report?
In this article, let’s break down the common metrics from plantar pressure plate analysis and teach you how to read the hidden signals your body sends through your feet.
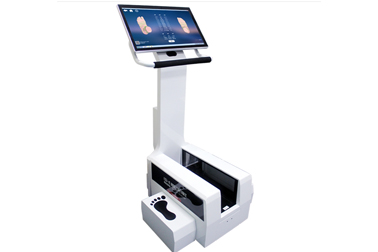
1. What Does a Plantar Pressure Plate Do?
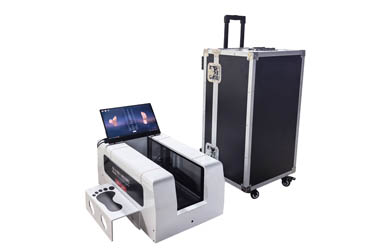
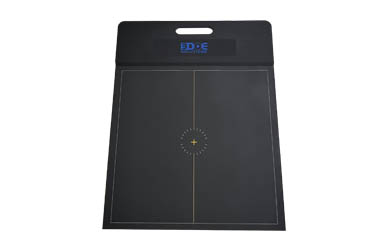
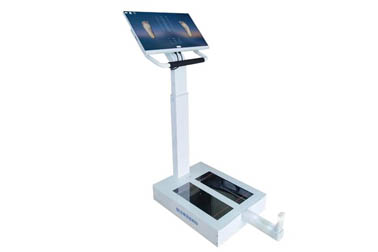
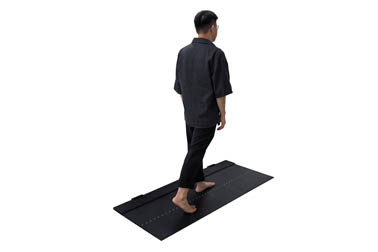
A plantar pressure plate is a smart platform embedded with thousands of sensors. It captures dynamic data such as pressure distribution, timing sequences, and center of gravity trajectories while a person is standing, walking, or running.
Simply put, it's like a “detective under your feet” that uses numbers and images to visualize how force is applied when you move. It plays an important role in gait analysis, custom orthotic design, and fall risk prediction.
2. Common Data Metrics Explained
Peak Pressure
Indicates the highest pressure recorded at specific areas of the foot (such as the forefoot or heel), usually measured in kilopascals (kPa).
For example, high peak pressure in the forefoot may be related to frequent high heel use or excessive load on the metatarsals.
Contact Area
Refers to the total area of the foot in contact with the ground, measured in square centimeters.
A larger area means more even pressure distribution; a smaller area may suggest a collapsed arch or concentrated stress points.
Center of Pressure Path (COP)
Tracks the movement of your center of gravity while standing or walking.
Ideally, the path should be smooth and symmetrical. Irregular or skewed paths may indicate gait abnormalities or muscle imbalances.
Symmetry Index
Measures whether both feet are bearing weight evenly.
A significant difference may suggest compensatory behavior, possibly due to an old injury or habitual weight shifting.
Load Distribution Percentage
Shows the proportion of body weight borne by each foot and different foot zones (forefoot, rearfoot).
In a healthy individual, this should be relatively balanced. A notable shift may indicate joint misalignment, pelvic tilt, or poor posture.
3. How Can This Data Help?
Custom Orthotics: Design insoles tailored to your pressure map to relieve foot discomfort.
Gait Training and Rehabilitation: Correct improper walking patterns and improve movement efficiency.
Fall Risk Assessment: Detect unstable balance or load asymmetry early, especially for older adults.
Children’s Foot Development Monitoring: Spot early signs of arch collapse, toe-in/out gait, and address issues during the optimal intervention period.
 Back to list


 +86-0755-86131192